


Checking CPU, RAM, and SSD capacity on a Windows VPS
Check CPU, RAM, and SSD capacity on a Windows VPS
In today’s digital era, managing Virtual Private Servers (VPS) is an essential skill for many IT professionals and enthusiasts. One crucial aspect of VPS management is monitoring the hardware resources such as the CPU, RAM, and SSD capacity. Accurately tracking these resources ensures optimal performance and helps in troubleshooting any potential issues. In this comprehensive guide, we’ll cover several methods to check the CPU, RAM, and SSD capacity on a Windows VPS using built-in tools like Task Manager, System Information, Command Prompt, and third-party applications like Speccy, CPU-Z, and CrystalDiskInfo.
Using Task Manager
Opening Task Manager
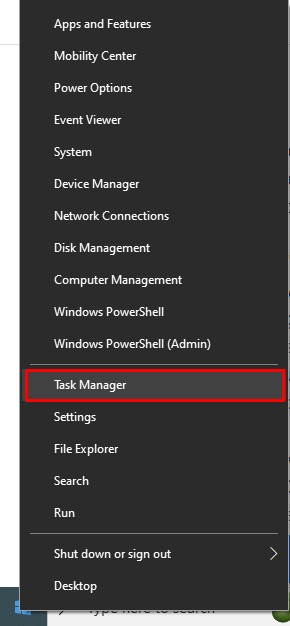
Task Manager is the go-to tool for many users when they need to monitor system performance. It provides a user-friendly interface that displays real-time data on system resource usage. To open Task Manager, you can press Ctrl + Shift + Esc on your keyboard, or right-click the taskbar and select “Task Manager” from the context menu.
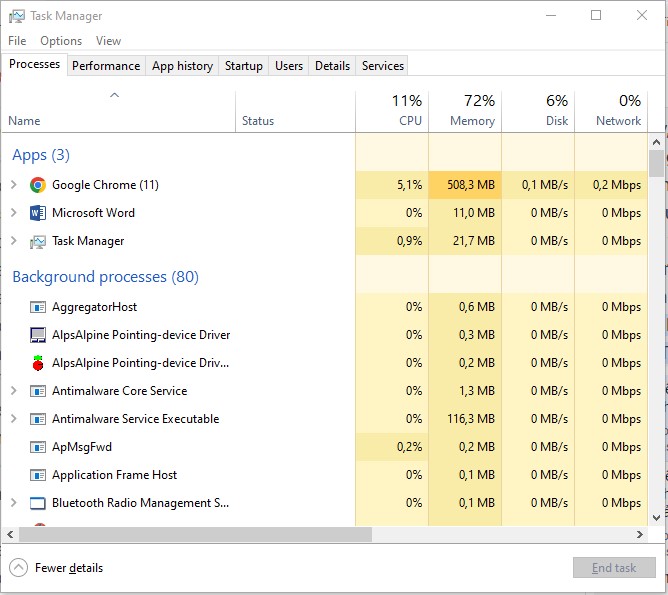
Once Task Manager opens, you’ll be greeted by a simple window with different tabs, each providing specific information about your system. While the Processes tab is useful for quickly identifying which applications are consuming resources, our focus will be on the Performance tab for detailed hardware information.
Navigating to the Performance Tab
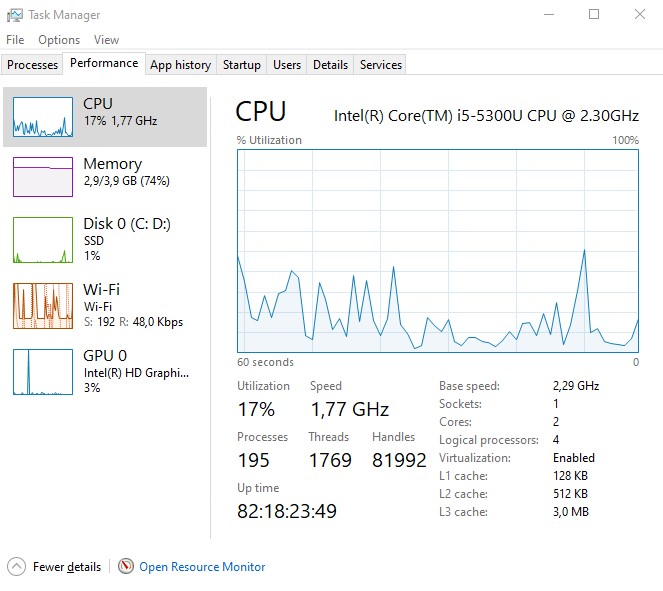
The Performance tab in Task Manager displays real-time utilization statistics for your system’s CPU, memory, and storage. When you click on this tab, you’ll see several sub-sections like CPU, Memory, Disk, Ethernet, etc. Each section is dedicated to a different resource, making it easier to navigate through them.
Imagine Task Manager as your car’s dashboard. The Performance tab is akin to the speedometer, fuel gauge, and temperature indicator—all the crucial metrics right in front of you. Accurate monitoring here can help you identify unusual spikes or dips in resource usage that could indicate impending issues.
Viewing CPU Usage and Speed
Under the Performance tab, click on CPU. This section will show you:
- CPU Usage: The percentage of your CPU currently in use.
- CPU Speed: The clock speed of your processor measured in GHz.
- Processes: Number of active processes.
- Threads: Number of threads running.
- Handles: Number of system handles in use.
By closely monitoring these metrics, you can detect performance bottlenecks. For example, consistently high CPU usage might indicate that your VPS is under heavy load, potentially impacting your applications.
Checking RAM Usage and Total Capacity
Next, click on Memory under the Performance tab. Here, you can see:
- Total Memory: The total amount of installed RAM.
- In Use (Compressed): The amount of physical memory currently in use, including any compressed memory.
- Available: The amount of memory available for use.
- Cached: The amount of RAM used for temporary storage.
- Paged Pool/Non-paged Pool: Memory allocation metrics that can be key indicators of system performance.
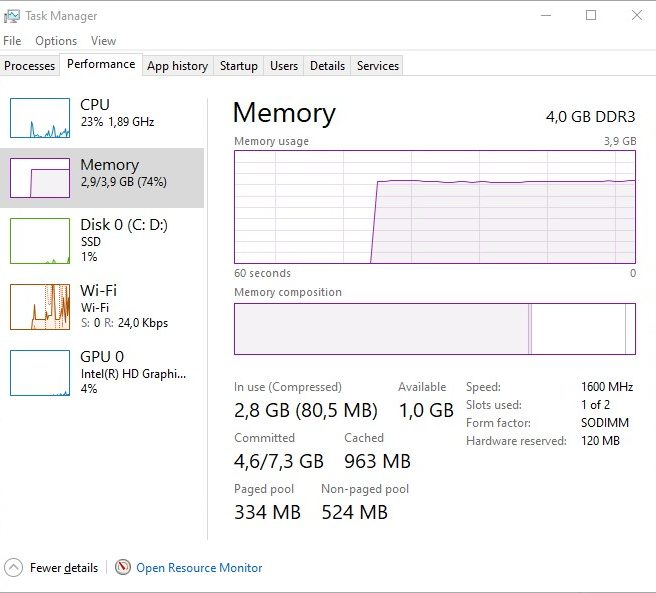
If your VPS seems sluggish, checking these metrics can reveal if you’re running low on RAM. For instance, if the Available memory is consistently low, it might be time to upgrade your VPS plan or optimize your current applications.
Monitoring Disk Usage and Free Space
Finally, click on Disk. Under this section, Task Manager displays:
- Disk Activity: The percentage of disk in use.
- Read/Write Speed: How fast data is read from or written to the disk.
- Capacity: The total storage capacity.
- Free Space: The remaining free space on your disk.
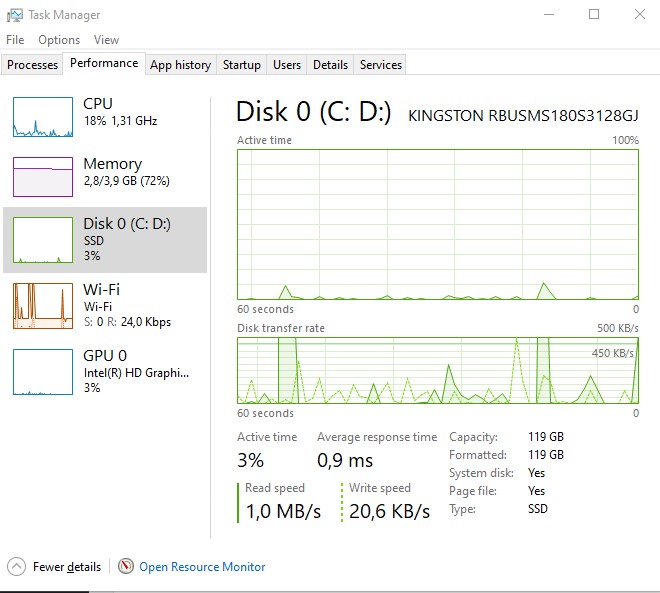
Just like a car’s fuel gauge, monitoring disk space is crucial for maintaining system health. Running low on disk space can severely affect the performance and stability of your VPS. Regularly checking this can help you plan for necessary upgrades or cleanups.
Using System Information
Opening System Information
System Information is another built-in Windows tool that provides detailed insights into your hardware and software configuration. To open it, press Windows key + R, type msinfo32, and press Enter. This command launches the System Information window, which is your treasure trove of system details.
Consider System Information as an encyclopedia of your VPS. Unlike Task Manager, which gives you real-time data, System Information provides a comprehensive overview of your hardware specs.
Viewing CPU Information
In the System Information window, under the System Summary section, you can find:
- Processor: Detailed information about your CPU, including its model, clock speed, and the number of cores.
Understanding this information can help you match your server’s capabilities with your application’s requirements. For example, a powerful multi-core processor is beneficial for running multiple applications or virtual environments simultaneously.
Checking RAM Information
Expand the Components section in System Information and click on Memory. Here, you’ll find:
- Total Physical Memory: The total amount of RAM installed.
- Available Physical Memory: The amount of RAM currently available to the system.
- Total Virtual Memory: Combined total of physical and paged memory.
- Available Virtual Memory: Amount of virtual memory currently available.
These details can be extremely helpful when diagnosing memory-related issues. Understanding the difference between physical and virtual memory can also guide you in optimizing your system’s performance.
Accessing Disk Information
To get detailed information about your SSD, expand the Components section and click on Storage > Disks. This section displays:
- Model: The model of your storage device.
- Size: The total capacity of the device.
- Partitions: Information about different partitions on the disk.
Imagine this as looking under the hood of your car to check the engine and other mechanical components. Knowing what SSD you have and its characteristics can help you decide if you need an upgrade or if the current disk meets your needs.
Using Command Prompt
Opening Command Prompt
For those who prefer command-line tools, the Windows Command Prompt offers powerful ways to gather system information. To open Command Prompt, press Windows key + R, type cmd, and press Enter.
Think of Command Prompt as your vehicle’s diagnostic computer. While not as visually appealing as Task Manager or System Information, it offers a straightforward way to get into the nitty-gritty of your system’s hardware.
Checking CPU Information with wmic cpu get *
To check CPU information, type:
wmic cpu get *
This command will output various details about the CPU, including its name, clock speed, number of cores, and more. For example, you’ll see fields like Name, CurrentClockSpeed, NumberOfCores, NumberOfLogicalProcessors, etc.
By parsing through this information, you can glean comprehensive details about your processor, helping you to fine-tune your server’s performance or plan for upgrades.
Checking RAM Information with wmic memorychip get *
To check RAM details, use:
wmic memorychip get BankLabel, DeviceLocator, MemoryType, TypeDetail, Capacity, Speed
This command provides detailed information about each memory module, including:
- BankLabel: The designation of the memory slot.
- DeviceLocator: The physical location of the memory module.
- Capacity: The size of the memory module in bytes.
- Speed: The speed of the memory module.
Understanding these specifics can help you diagnose memory issues or verify that installed memory meets your server’s performance needs.
Checking SSD Information with wmic logicaldisk get *
To view SSD and other disk information, type:
wmic logicaldisk get *
This command provides extensive details about logical disks, including their size, free space, file system, and more. Additional useful commands include:
- wmic logicaldisk get caption: Retrieves the caption for each logical disk.
- wmic logicaldisk get size: Displays the total size of each logical disk.
- wmic logicaldisk get freespace: Shows the available free space on each logical disk.
By running these commands, you can quickly and accurately assess your disk’s health, ensuring that you have enough free space and that the file system is functioning correctly.
Using Third-Party Tools
Speccy
Speccy is a user-friendly tool developed by Piriform that provides detailed information about every hardware component in your computer, including the CPU, RAM, and SSD.
To use Speccy:
- Download and install Speccy from the official website.
- Launch the application. It automatically starts a scan of your system’s hardware and displays all relevant data in an organized manner.
Speccy offers a deep dive into your system’s internals. Think of it as a comprehensive medical report. You’ll see everything from the CPU’s temperature to the SSD’s health status.
CPU-Z
CPU-Z is another excellent third-party tool that specializes in CPU information but also provides details on RAM and other components.
To use CPU-Z:
- Download and install CPU-Z from its official website.
- Launch the application. It quickly scans your system and displays detailed information about your CPU, including its name, clock speed, cache size, and more.
Moreover, the Memory tab in CPU-Z provides data about your RAM’s type, speed, and timing parameters, essential for anyone looking to optimize memory performance.
CrystalDiskInfo
CrystalDiskInfo is perfect for those who want detailed information about their storage devices.
To use CrystalDiskInfo:
- Download and install CrystalDiskInfo.
- Launch the application, which automatically detects and displays data about your SSD and other disks.
It offers comprehensive stats, including Health Status, Total Host Writes, and more. Regularly checking these metrics can help you preemptively address issues before they cause data loss or server downtime.
Conclusion
Monitoring the CPU, RAM, and SSD capacity on a Windows VPS is essential for maintaining optimal performance and stability. Each tool—be it Task Manager, System Information, Command Prompt, or third-party applications like Speccy, CPU-Z, and CrystalDiskInfo—offers unique benefits and insights into your system’s health.
By mastering these tools, you not only ensure your VPS runs smoothly but also gain the knowledge to make informed decisions about potential upgrades or configurations. Whether you’re managing a complex server environment or running a simple VPS, this comprehensive guide equips you with the know-how to maintain and optimize your system’s hardware resources effectively.
Dainty Cloud hopes this article will provide you with useful information about check CPU, RAM, and SSD capacity on a windows VPS. If you have any questions about VPS service, please contact us for advice. Consulting and registering for a free VPS account.


Related News


What is Anti DDoS? Anti-DDoS methods